Analysis of the Results
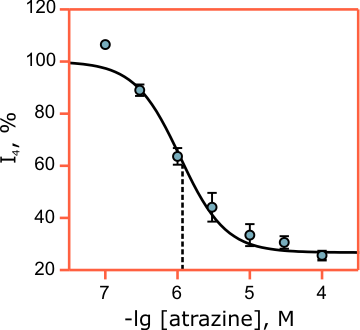
Fig. 15. Dose-response curve

Dose-response curve showing the amplitude of the I4 peak of the DFIC in pea leaves treated with different concentrations of atrazine. Values are relative to the untreated control. Error bars represent standard error of the mean. The curve is obtained by fitting the data to a sigmoidal function.